Director Advanced Visualization Laboratory (AVL)
National Center for Supercomputing Applications (NCSA)
Download
Paper PDF
MP3 of presentation
Abstract
The author is a Professor of Design and has successfully collaborated with computational scientists on data visualization projects for over 22 years. Data-driven scientific visualizations permeate culture and have become important tools for science discovery and public outreach education. The author provides a history of successful “renaissance team” collaborations where artists have played a major role in the process of scientific visualization. The outcomes have been measurable and lead to some generalizations about interdisciplinary collaborative projects.
Keywords
1. Introduction and Prior Work
In its broadest sense, visualization involves the process of making the invisible visible. It has been an important human activity for tens of thousands of years. From cave paintings to virtual CAVE™ environments, the process of making the cognitive imagination visually tangible using culturally-dominate technologies is one of the most consistent behaviors of human kind. Dominate technologies ascend with time from Paleolithic carving tools to modern digital information technology (IT). Modern IT visualization is a way of organizing the incoming "kaleidoscopic" flood of data. Data is defined as a system of numbers that provides measurable, quantitative information. Scientific computational models, instrument sensing, geographic, statistical, and contextual information comprise data. The scientific visualization process employs IT to transform scientific simulation data into digital representations or visual models.
Scientific visualizations permeate society and have become an important part of visual culture. Large audiences view them in magazines, television, and planetarium shows. Well-respected scientific journals such as “Science” and popular magazines such as National Geographic regularly feature data informed scientific visuals. They are powerful informants due to the scientific and technological authority that they wield. Creative practitioners skilled in visual literacy have a great deal to contribute to this process, and interdisciplinary collaboration is a key component to successful outcomes.
2. Renaissance Teams
In 1985, Professor Donna Cox began organizing “Renaissance Teams” at the NCSA-UIUC [Cox 88A]. She coined the term “Renaissance Teams” to describe multidisciplinary teams of experts focused on solving visualization problems and provided a guidelines for successful collaborations [Cox 88B]. These guidelines remain relevant to current discussions about synergy among creative practice, collaboration, education and IT. Guidelines are summarized below. A Renaissance Team is a group of interdisciplinary specialists who interact to enlarge the problem-solution domain and provide technological, analytical, and visual synergism in the quest for knowledge and information discovery. Teamwork requires a non-trivial psycho-strategy. Here are some codes of behavior for successful teams.
- There must be a common, passionate goal for the team members
- Members must have mutual respect for each other member and his/her discipline
- Each member must be willing to learn from other members of the team
- Each member must recognize other’s intellectual territory
- The team should not have too many members
- The team must continually check to make sure that the research is making progress
- Members must not become over-committed to other projects
- One person must carry the flag for project as a champion and coordinate efforts
- Each member must be credited and given his/her recognition when the project is presented or publicized
- Each member must get something out of the project which is personally rewarding and tangible
Cox has collaborated with scientists, engineers, and technologists to create new technologies and visualization products. Renaissance Teams include many skills of the artist: production, direction, design, color, and editing. In many cases, the artist leads the technology or innovation. For example, Cox and research artist, Robert Patterson, NCSA, created the first data-driven visualization of the NSFnet. This image is one of the most popular data visualizations of the early internet. The public continues to request this iconic visual showing the enormous growth of the national network from 1991-1993 [Figure 1].
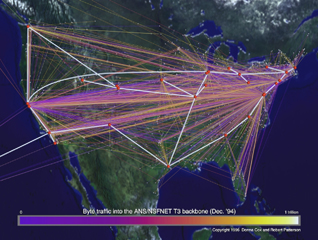
Figure 1: The color map indicates flow of network traffic measured in millions of bytes.
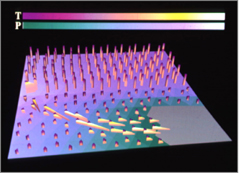
Figure 2: First 3D visualization using glyphs, computer graphics animation and two color transfer functions to show plastic injection molding.
Cox collaborated with Dr. Richard Ellson, Kodak Research Scientist, to create the first 3-D data-driven computer graphics representation of plastic injection numerical simulation (Ellson, Cox 88). Figure 2 shows the unusual but useful representation of the numerical data. The ‘glyphs’ represent temperature, pressure, and velocity. In the 90’s, Cox brought this type of project-based collaborative approach to the classroom through experimental courses designed to teach the collaborative process in interdisciplinary groups. She presented this methodology in an EDUCOM keynote address [Cox 91]. Collaboration and project-based learning are key components to this educational philosophy that encourages creativity in the classroom. Collaboration is also a key component in many large-scale projects.
In 1994, Cox was Associate Director for Scientific Visualization and Art Director for the PIXAR/NCSA segment of a large-scale film project. “Cosmic Voyage,” an IMAX movie about the relative scale of things in the universe, was nominated for an Academy Award in 1996 [COX 1996, 2003]. This IMAX film continues to educate the public about the evolution of the universe. The advanced technologies of supercomputing and visualization were employed to artistically render images of galaxies colliding in swirling paint-like effects. This movie was unprecedented in the use of scientific visualizations instead of special effects to show astronomical phenomenon.
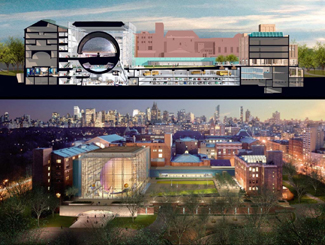
Figure 3: The cutaway view of the digital dome in the Hayden Planetarium at the American Museum of Natural History in New York City
3. Virtual Director and the Hayden Planetarium
In the making of “Cosmic Voyage,” Cox, Robert Patterson, and Marcus Thiébaux, then a student at University of Illinois created Virtual Director™. They patented this software framework that provides a virtual choreography and navigation system to enable users to see and control the virtual camera in 3-dimensional stereo, to record frames and to preview the recording on virtual screens. Virtual Director™ also provides capabilities to collaborate over the Internet so that users can interact together even though they may be located at great distances from each other geographically. To create the following shows and exhibits with the Hayden Planetarium, the NCSA team used Virtual Director’s remote virtual collaborative capabilities over the Internet2: from the University of Illinois to the New York City digital dome (see Figure 3). The NCSA team worked from Illinois and collaborated in real-time with the Hayden Planetarium artists and scientists to design, choreograph, and render virtual experiences through data-driven scientific visualizations.
The NCSA team has collaborated to create two “space” shows in the large upper digital dome and the Big Bang Theatre exhibit located in the lower section of the digital dome. The first “space” show was called “Passport to the Universe,” narrated by actor Tom Hanks, opened at the Millennium 2000 New Year’s donor celebration. The second “space” show, “The Search for Life,” narrated by actor Harrison Ford, opened February 2002. Both of these high-resolution, digital shows are exhibited in the upper hemisphere of a large digital dome (over 9 million pixels), which provides an immersive experience to 440 people during each 17-minute show. Millions of people have seen these science education shows in the last few years.
In addition to museums and planetariums, the NCSA team also developed visualizations for broadcast television shows. They produced visualizations for the High-Definition (over 2 million pixels) Television Public Broadcasting System (PBS) NOVA/WGBH show, “Runaway Universe” and a Discovery Channel program, “Unfolding Universe.”
4. IntelliBadge™ Project
IntelliBadge™ is another collaborative arts and technology project. IEEE and NCSA provided resources to develop this technological experience for the Supercomputing 2002 (SC02) Conference attendees, November 16-24, Baltimore Convention Center. Cox directed a “skunk works” team to develop a system for location tracking and real-time digital visualization. About 1000 conference attendees volunteered to carry Radio Frequency Identification (RFID) tags during the events. Real-time visualization of attendees showed the flow patterns of people attending various events during the conference. This system included a real-time database, interactive visualization software, and a web application. Participants logged into the system to check attendee statistics and gather information at the IntelliBadge™ website. Several visualization schemes were developed to show the flow of people at the conference. Figure 4 & 5 are images from real-time visualizations that were projected at various locations within the convention center. Figure 4 shows the data as dynamic bars charts.
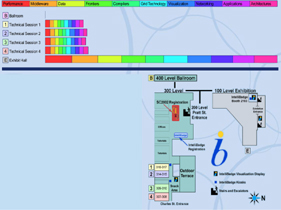
Figure 4: Data on bar graphs
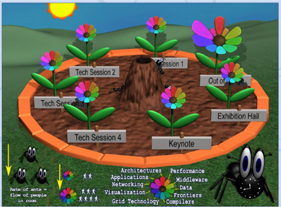
Figure 5: Novel Visual Metaphor with same data
An alternate visualization scheme called “How Does Your Conference Grow” provided a garden metaphor with each flower representing a conference event room (see Figure 5). Each flower scaled according to the number of people in the room and its petals grew or shrank as people entered or exited the rooms. Ants entering and leaving the flowers represents the rate of people moving through the locations. The real-time visualization of the data of people and their interests moving throughout the physical space employed similar techniques as the other data-driven visualizations. The garden metaphor was in great contrast to other more conventional visualizations such as animated bar charts (see Figure 4). Artists can contribute to new perspectives and new ways of looking at data, generating new visual models and novel ways of representation.
NCSA AVL collaborates with scientists to develop and use cyberinfrastructure to create visualizations for both discovery and outreach. Figure 6 shows a visualization of a simulation of a F3 tornado. The AVL team created new visualization glyph representation in collaboration with computational scientists. NCSA chief science officer Robert Wilhelmson and Lou Wicker at the National Severe Storms Laboratory, used high-performance computers at NCSA to model the birth of a tornado, starting with data on the environmental conditions that produced a powerful tornado in South Dakota. The simulation helped the researchers zero in on the mechanisms that spawn a tornado. The NCSA team then translated the data and insights into a dynamic, high-definition animated visualization. Millions of people saw this story and the visualizations in a PBS NOVA show called “Hunt for the Supertwister.”
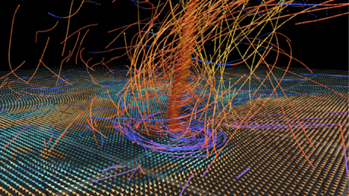
Figure 6: Visualization of an F3 Tornado
5. The Black Holes Project
The “Black Holes Project” was a partnership among Thomas Lucas Productions, Denver Museum of Nature and Science, NCSA, and ES/Spitz. The National Science Foundation funded a proposal to develop media products for outreach and education [NSF proposal ISE Award #0337286 for the project]. The media products include:1) a full-dome planetarium show, Black Holes: The Other Side of Infinity, (additional information); 2) one-hour NOVA program, Monster of the Milky Way; and 3) a website with customized activities and sequences, links to related sites, outreach materials and supporting resources for teachers and informal educators. The key staff in the production was Tom Lucas, with the responsibility as the overall Director of the NOVA and planetarium shows; Donna Cox co-Producer of the NOVA and planetarium shows and Director of the data-driven scientific visualization; Jodi Schoemer, Executive Producer of the planetarium show; and Dr. Andrew Hamilton, Science Director of the planetarium show.
The Project features a broad collaboration of scientists and scientific organizations to visualize a range of observational data and computer simulations. The Project leveraged the unique capabilities of its partner institutions, including NCSA’s own state-of-the-art computational clusters to visualize large-scale data. AVL developed all of the data-driven visualizations of scientific supercomputer simulations for the Project. The NCSA AVL team designed and rendered scientific visualizations for the Project. In the process of developing these visualizations, new software tools were developed to solve specific challenging problems such as the visualization of Adaptive Mesh Refinement data. The NCSA team employed web collaborative technologies to document scene progress, communicate with collaborators, and distribute test visualizations for preview of the digital dome tests.
6. Evaluation for planetarium and television show
To integrate a fully objective view of outcomes of this Project, Multimedia Research completed a thorough summative evaluation. They tested representational audiences before and after seeing the show to measure efficacy of concept communication. They selected random museum visitors and interviewed them to assess the longer-term impacts and affective response to the production. The WestEd Company of San Francisco, California, performed an evaluation of teacher materials.
At initial stages of evaluation, the Project team found a level of audience interest that justified reaching more sophisticated and higher-level content in Black Holes: The Other Side of Infinity, the digital planetarium show. This approach was validated by the results of the summative evaluation for audiences. According to the report, viewing the show “significantly increased 4th and 5th graders’ understanding” of black holes. As examples, before viewing the show only 12% and 16% of students gave correct answers to the questions “What is a black hole?” and “How do scientists know black holes exist?” After viewing the show, those numbers jumped to 60% and 63% respectively. The study concluded that the show “successfully both entertains and educates the upper elementary age student.”
Throughout the production process, the Project advisors reviewed scripts and storyboards. These reviews focused on the accuracy of scientific content, the effectiveness of the story, the presentation of scientific visualizations, and the suitability of the show for targeted audiences. Audiences provided input in the process during the front-end and summative stages. Front-end evaluation for this project consisted of intercepting a minimum of 200 randomly selected visitors from the target audience and exploring their existing knowledge, pre-conceptions, interests and attitudes towards the subject of black holes. Results from these audience studies informed the design and development of the planetarium program, scientific visualizations, and teacher materials.
Focus groups revealed a very important point not known prior to developing this unique show that required extensive scientific visualizations: the audience wants to know when they are viewing data-driven scientific developed from scientific numerical models. They wanted to know they were seeing “real science” as opposed to just special effects or computer graphics. This awareness seemed to help validate the show.
The initial research and writing for the NOVA show was supported by a grant from NASA’s GLAST Project. After this initial work, the Program Treatment was formally reviewed by NOVA staff members and Executive Producer. The NOVA show Monster of the Milky Way required additional scientific visualizations beyond those in the Black Holes: the otherside of infinity. The script was prepared for an adult, scientifically aware audience. The NOVA program was evaluated formally in a two-step process. A formative evaluation was performed by Multimedia Research of Bellport, NY. The treatment was sent out to independent reviewers prior to the beginning of principal photography. They commented on the clarity of the presentation, the strength of the story lines, and achievement of overall science education goals. Once the program was assembled into a rough cut, it was shown to adult and high school audiences. A summative evaluation was performed by Knight-Williams Research Communications of Sacramento, CA. Prior to the broadcast, the completed program was screened by high school and adult focus groups across the country. The main goal was to judge the clarity and effectiveness of the overall presentation. The groups considered specific elements such as the scientific visualizations, graphics, on-screen characters and the attractiveness of the content. The NOVA program was a success. In general, “The program addressed many difficult and abstract science concepts, yet was still enjoyed by and successful with a diverse viewing audience, one that extended beyond the traditional PBS viewer, science/nature show enthusiast, or astronomy buff.”
7. Broad Impact
Full-dome digital theaters are an important emerging venue for education and entertainment. More than 100 million people visit about 3,000 planetariums worldwide each year. Since 1999, over 300 of these institutions have built new digital dome theaters or retrofitted existing domes (a planetarium attendance table and a compendium of full-dome theaters. The demand for high-quality programs increases with the growing popularity of these digital venues. In its first 18 months of distributing Black Holes, ES Spitz, Inc. licensed the show to more than 30 theaters ranging in size from the nearly 300-seat venue in Chicago’s Adler Planetarium down to 50-seat university theaters. The total audience of more than 600,000 people to date will continue to rise over the program’s shelf life of five to ten years. In its first year at the DMNS Gates Planetarium, for example, Black Holes: The Other Side of Infinity was seen by over 150,000 people including about 40,000 school children. (list of theaters leasing “Black Holes” . The opening of Black Holes in February 2006 was covered by national publicity that yielded numerous high-profile press reviews.
The Black Holes Project has had a broad impact by reaching, entertaining and educating millions through two of the most important informal education venues in the US: Science Museums and Public Television. “Edu-tainment” reflects a way that artistic presentation of content can engage the public in alternative experiential venues beyond academic lectures or scientific publications. The Project featured a unique synergy between design and research, and it has provided a magnet for some of the most advanced astrophysical simulations to date.
8. Conclusions
This paper describes many collaborative research and production projects where artists collaborate with scientists, develop new technologies, and solve challenging visualization problems. The results have been successful in bringing science to large numbers of non-expert audiences and providing innovative tools for visualization. Success is measured by patents, publications, formal evaluations of the visualization products, and the numbers of people who are engaged by the productions.
Does this renaissance team collaborative process scale? Early collaborations among renaissance teams had less than eight team members. Much larger productions such as IMAX movies and digital planetarium shows require global renaissance team collaboration. These collaborations have been successful because of building upon successful teamwork and simple rules of engagement. Advanced technologies have helped this process ... but more importantly, social engineering is the key to success. The technology cannot replace the interdisciplinary etiquette that fosters social exchange, mutual respect, and personal rewards.
References
Cox, D., V. Kindratenko, and D. Pointer. 2003. IntelliBadge(tm): Towards Providing Location-Aware Value-Added Services at Academic Conferences. in UbiComp 2003: Ubiquitous Computing A. Dey, A. Schmidt, and J. McCarthy, p. 264-80 Berlin: Springer.
Cox, D, Patterson, R. and Thiebaux, M. inventors. 28 November 2000. "Virtual Reality 3D Interface System for Data Creation, Viewing and Editing. USA 6154723 .
Cox, D. 1988. Using the Supercomputer to Visualize Higher Dimensions: An Artist's Contribution to Scientific Visualization. Leonardo 21: 233-42.
Cox, D. 1988 SIGGRAPH 1988 education course #29, Collaboration in Computer Graphics Education, SIGGRAPH 1988 education course #29, "Renaissance Teams and Scientific Visualization: A Convergence of Art and Science," page 83 - 103.
Cox, D. 1989 The Tao of Postmodernism: Computer Art, Scientific Visualization, and Other Paradoxes. ACM SIGGRAPH '89 Art Show Catalogue, Computer Art in Context Leonardo Supplemental Issue : 7-12.
Cox, D. 1990 Scientific Visualization: Mapping Information. AUSGRAPH '90 Proceedings, 101-6Australia: Australian Computer Graphics Association.
Cox, D. 1991. Collaborations in Art/Science: Renaissance Teams. The Journal of Biocommunications 18, no. 2: 10-15.
Cox, D. 1992. Caricature, Readymades, and Metamorphosis: Visual Mathematics in the Context of Art. Leonardo 25, no. Number 3/4: 295-302.
Cox, D. 1996. Cosmic Voyage: Scientific Visualization for Imax Film. in Siggraph 96 Visual Proceedings, p. 129New York: ACM Press.
Cox, D. 2000. Creating the Cosmos: Visualization & Remote Virtual Collaboration. Consciousness Reframed.
Cox, D.2003 Myth Information. Toward a Science of Consciousness abstracts, service of the Journal of Consciousness Studies.
Cox, D. 2003. Algorithmic Art, Scientific Visualization, and Tele-Immersion: An Evolving Dialogue with the Universe. Art, Women and Technology.MIT Press.
Ellson, R, and D. Cox. 1988. Visualization of Injection Molding. Simulation: Journal of the Society for Computer Simulation 51, no. 5: 184-88.
Flagg, B. “Black Holes: The Other Side of Infinity, Summative Evaluation of Planetarium Film with Students,” June 5, 2006.
Knight-Williams, V., “Monster of Milky Way summative report,” September 2007.